Recently, I heard about a great tool for measuring consumer interest called Google Insights for Search. Why is it so great? Well, let's say you wanted to figure out which DRTV company has the hottest hit right now. You could look at the charts, but the problems with that methodology are well known.
First, the charts report media spending based on the old assumption that strong spending equals strong response. It's not that this is necessarily a bad assumption, it's just that the DR methodology is no longer pure. In the old days, when most of the money was made on direct sales from TV, you'd have to be an idiot to spend beyond profitability. Today, with retail comprising about 90% of sales, we keep getting closer to a traditional model where advertising is an expense and not a profit center. The charts are a relic: Today, everyone has a different tolerance for losing money on TV in the hopes of making it back at retail.
Second, the charts are manipulated. I am not breaking any news here, so I'll be brief. There are 75 rated cable networks and growing. Monitoring every hour of programming on every one of these networks would be a Herculean task, so the monitoring services don't even try. (I'm not saying I blame them.) But as someone with a basic understanding of statistics, I can tell you the handful of stations and rotations they do monitor are not even close to a representative sample. So the charts are hopelessly inaccurate from the get-go. Add to that the scandal of inflated self-reporting and -- now you know why I created the True Top 50.
And that's why I love this new Web tool. You can't manipulate consumer interest (as anyone who has forced an item into retail can attest), and Google keyword searches are a great indicator of that interest. For fun, let's take the charts' top five hits from the Big Five (short form), and see what Google Insights for Search has to say.
According to latest reports:
- Emson's Micro Plus is the hottest at No. 3 on both charts
- Telebrands' Sticky Buddy is the next hottest at No. 4 on the JW
- IdeaVillage's Music Bullet is next at No. 9 on the JW
- Ontel's Miracle Socks is next at No. 21 on the IMS
- Allstar's EZ Eyes is last at No. 32 on the JW
Now, here are searches for those five trademarks over the last 30 days (click to enlarge):
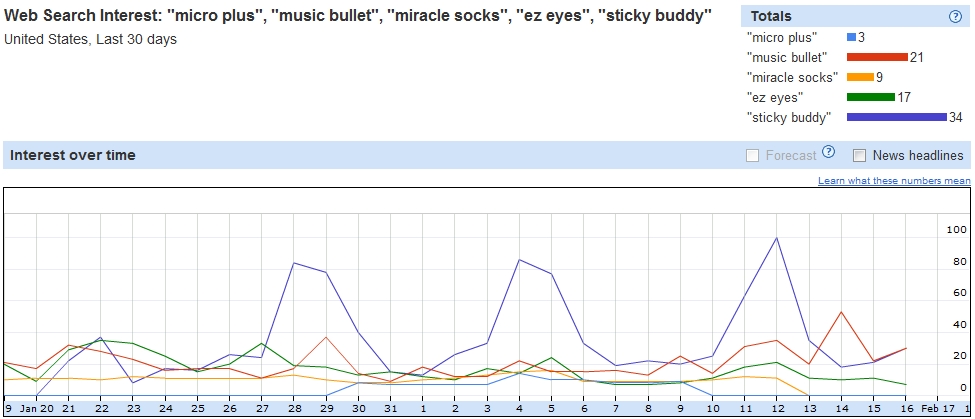
As you can see, the order based on consumer interest should be:
- Telebrands' Sticky Buddy with an average of 34 searches per day
- IdeaVillage's Music Bullet with an average of 21 searches per day
- Allstar's EZ Eyes with an average of 17 searches per day
- Ontel's Miracle Socks with an average of 9 searches per day
- Emson's Micro Plus with an average of 3 searches per day
It gets more interesting when we start looking at a company's hits relative to each other. Let's take Allstar and Telebrands as examples.
Allstar's top three hottest hits, according to the charts, are EZ Eyes (No. 32 on the JW), Trendy Top (No. 39 on the IMS) and Hot Booties (No. 47 on the JW). Now here's what Google's tool says:
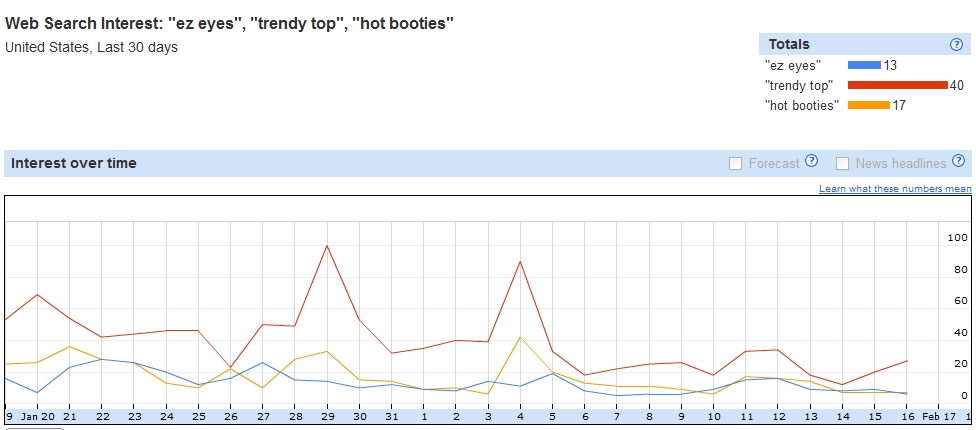
Trendy Top blows the other two away with 40 searches per day, making it hotter than even Sticky Buddy, which is 17 places higher than it on the IMS chart.
Speaking of Telebrands, their top three hottest hits are Sticky Buddy (No. 4 on the JW), Lint Lizard (No. 8 on the JW) and Plaque Blast (No. 8 on IMS). But according to the Google tool:
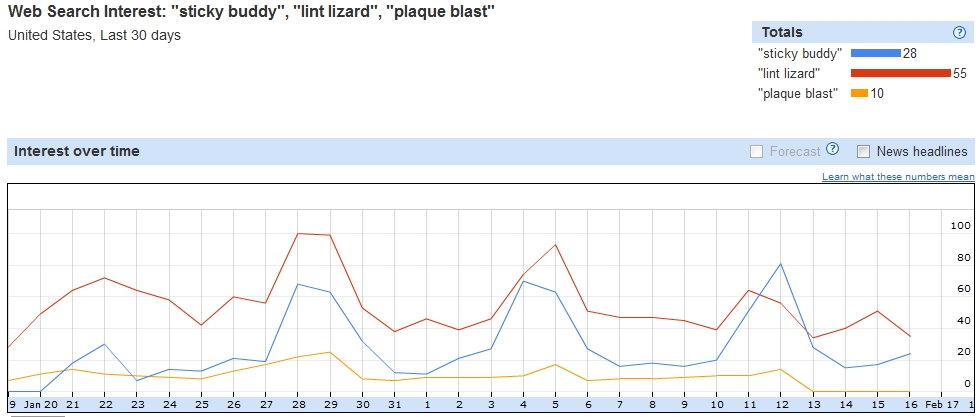
Lint Lizard is clearly dominant with even more searches per day than Trendy Top and almost double the searches of Sticky Buddy.
I could go on, but you get the point. Want to know how hot your campaign is relative to the competition? Check out Google Insights for Search yourself.